
Introduction
A customer receives a drink from Starbucks barista millions of times each week, but each interaction is unique. This is just a moment in time, but nevertheless a connection. How does this customer behave, and what prompts them to make a purchase? To find out, we can use a simulated dataset that mimics customer behaviour on the Starbucks rewards mobile app. Once every few days, Starbucks sends out an offer to users of the mobile app. An offer can be merely an advertisement for a drink or an actual offer such as a discount or BOGO (buy one get one free). Some users might not receive any offers during certain weeks.
Not all users receive the same offer, and that is the challenge to solve with this data set. Our task is to combine transactions, demographics and offer data to determine which demographic groups respond best to which offer type. This data set is a simplified version of the real Starbucks app because the underlying simulator only has one product whereas Starbucks actually sells dozens of products.
Every offer has a validity period before the offer expires. As an example, a BOGO offer might be valid for only 5 days. We’ll see in the data set that informational offers have a validity period even though these ads are merely providing information about a product; for example, if an informational offer has 7 days of validity, we can assume the customer is feeling the influence of the offer for 7 days after receiving the advertisement.
We’ll use transactional data showing user purchases made on the app including the timestamp of purchase and the amount of money spent on a purchase. This transactional data also has a record for each offer that a user receives as well as a record for when a user actually views the offer. There are also records for when a user completes an offer.
Keep in mind as well that someone using the app might make a purchase through the app without having received an offer or seen an offer. To give an example, a user could receive a discount offer to spend 10 dollars and get 2 off on Monday. The offer is valid for 10 days from receipt. If the customer accumulates at least 10 dollars in purchases during the validity period, the customer completes the offer.
We also want to take into account that some demographic groups will make purchases even if they don’t receive an offer. From a business perspective, if a customer is going to make a 10 dollar purchase without an offer anyway, we wouldn’t want to send a buy 10 dollars to get 2 dollars off offer. We want to try to assess what a certain demographic group will buy when not receiving any offers.
Since this is a capstone project, we are free to analyze the data any way we see fit. For example, we could build a machine learning model that predicts how much someone will spend based on demographics and offer type. Or, we could build a model that predicts whether or not someone will respond to an offer but we don’t need to build a machine learning model at all. We could develop a set of heuristics that determine what offer we should send to each customer (i.e., 75% of women customers who were 35 years old responded to Offer A vs 40% from the same demographic to Offer B, so send Offer A).
Project link: https://github.com/ags911/udacity-dsnd/blob/main/project-4/
Business Objectives
How can we find out if an offer will be successful?
- Create a Machine Learning model to predict if a customer will respond to an offer.
- What factors affect offer success?
- How do those factors affect offer success?
Data Understanding
The data is contained in three files:
- portfolio.json – containing offer ids and meta data about each offer (duration, type, etc.)
- profile.json – demographic data for each customer
- transcript.json – records for transactions, offers received, offers viewed, and offers completed
Here is the schema and explanation of each variable in the files:
profile.json
Rewards program users (17000 users x 5 fields)
- gender: (categorical) M, F, O, or null
- age: (numeric) missing value encoded as 118
- id: (string/hash)
- became_member_on: (date) format YYYYMMDD
- income: (numeric)
portfolio.json
Offers sent during the 30-day test period (10 offers x 6 fields)
- reward: (numeric) money awarded for the amount spent
- channels: (list) web, email, mobile, social
- difficulty: (numeric) money required to be spent to receive reward
- duration: (numeric) time for offer to be open, in days
- offer_type: (string) bogo, discount, informational
- id: (string/hash)
transcript.json
Event log (306648 events x 4 fields)
- person: (string/hash)
- event: (string) offer received, offer viewed, transaction, offer completed
- value: (dictionary) different values depending on event type
- offer id: (string/hash) not associated with any “transaction”
- amount: (numeric) money spent in “transaction”
- reward: (numeric) money gained from “offer completed”
- time: (numeric) hours after start of test
Project Plans
Step 1: The first step was to evaluate the data we had to work with. We had three JSON files to work with:
- portfolio.json – includes offer metadata,
- profile.json – includes demographic data for each customer, and
- transcript.json – includes records for transactions, offers viewed/received/completed.
Portfolio EDA
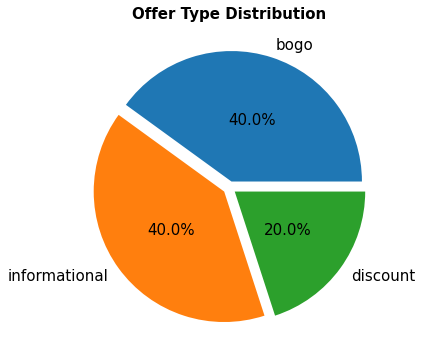
Figure 1: Offer type distribution
“40% of the offers consist of BOGO, only 20% are discounts…”
Portfolio Data Observations:
- There are three types of offer including BOGO, informational and, discount offers
- There are 10 different offers in total. 4 of them are discounts, 4 are BOGO (Buy One Get One Free), and 2 of them are informational (advertisments).
- The reward and difficulty columns are in USD (US Dollars) units.
- The duration column is measured in
days - The channel, offer_type, and id columns are categorical
- There are no null values
Profile EDA

We can see a large number of outliers here in the age column showing around 120 years of age. We could just use the median age to fill their values but the dataset would be imbalanced with most data points coming from the median age range. Since we only found 2175 ages over 115, we can safely delete them. We also found a pattern that all ages of 118 have a gender of none and income of NaN. This suggests to me there is an error with the data being input so it is useless to us even if we decided to impute the values.
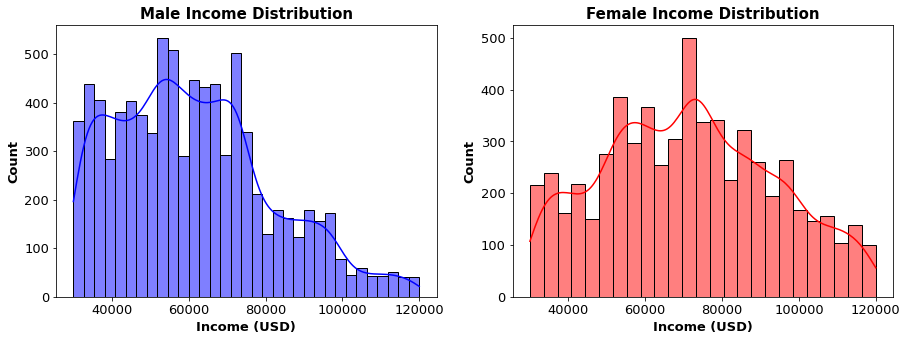
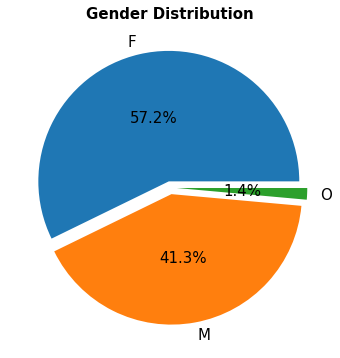
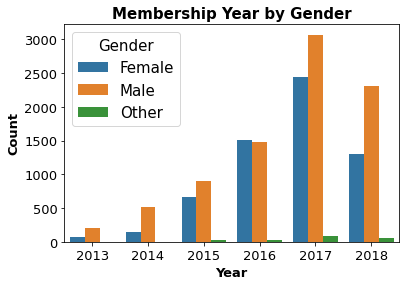
Figure 4: Gender distribution
“Over 57% of the customers are female and only 41% are male…”
Profile Data Observations:
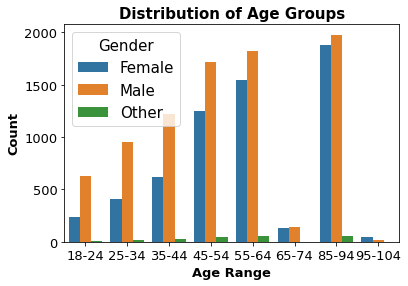
- The meadian and mean age of users is around 55 years old
- The maximum age is 118 which is an error, but the minimum age is 18
- Observations with age as 118 seem to be bad data since only the
idhash is provided - The income seems to have the most users between 50,000 to 70,000 USD which shows our demographic is mainly older, wealthier individuals
- The maximum income is 120,000 USD, but the minimum is 30,000 USD
idcolumn contains verbose hashes that can be converted to integers to make them easier to navigate- The hashes should be mapped to the Transcript DataFrame since we can match the id values
- Females account for 57.2% of the dataset, males account for 41.3% and other only 1.4%. The gender distribution could create some imbalance later
Transcript EDA
Transcript Data Observations:
- Found nested dicts in the transcript
valuecolumn from the json which need to be unpacked/flattened to fix the issue - There are no null values in the dataset
- Categorical columns found are person, value, event
Feature Selection
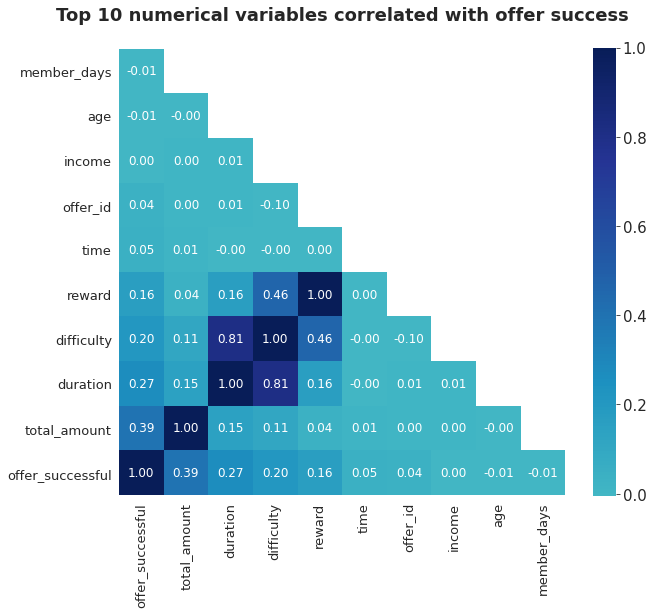
Looking at the correlation between the numerical variables and offer success we can see all the factors that affect if an offer will be successful. From our observations above we can conclude:
- Total amount: The total amount spent has the most dramatic effect on determining if an offer will be successful, this should be obvious since people who have completed an offer would have to spend money
- Duration: Duration of the offer has a big effect of offer success most likely because the informational offers have a shorter duration unlike the discount and BOGO offers
- Difficulty: Difficulty determines the amount a customer has to spend to qualify for an offer, it makes sense that this would be directly correlated with total amount spent
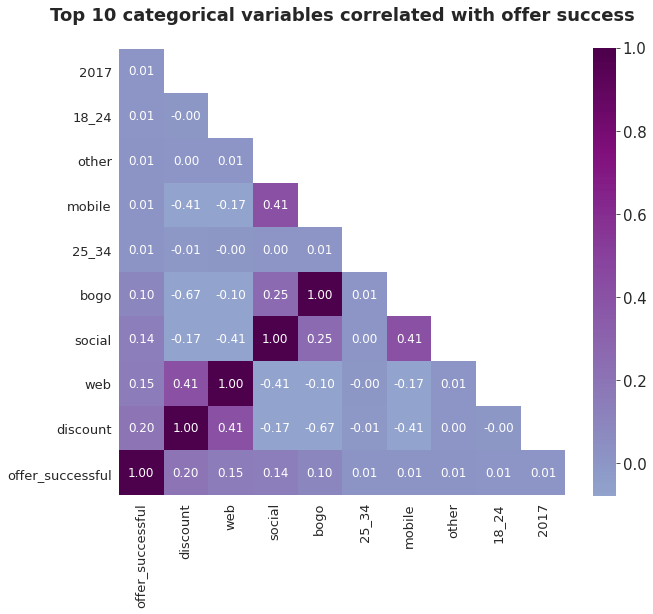
From the correlation between the categorial variables and offer success we can conclude:
- Discount: Discount offers have quite a significant effect on offer success, this is understandable as a discount is an incentive for a customer to spend money to save money
- Web & Social: these two marketing channels seem to have a great importance but since the majority of offers are sent through web and social channels
- Bogo: Bogo offers have half the effectiveness of discount offers but still strong


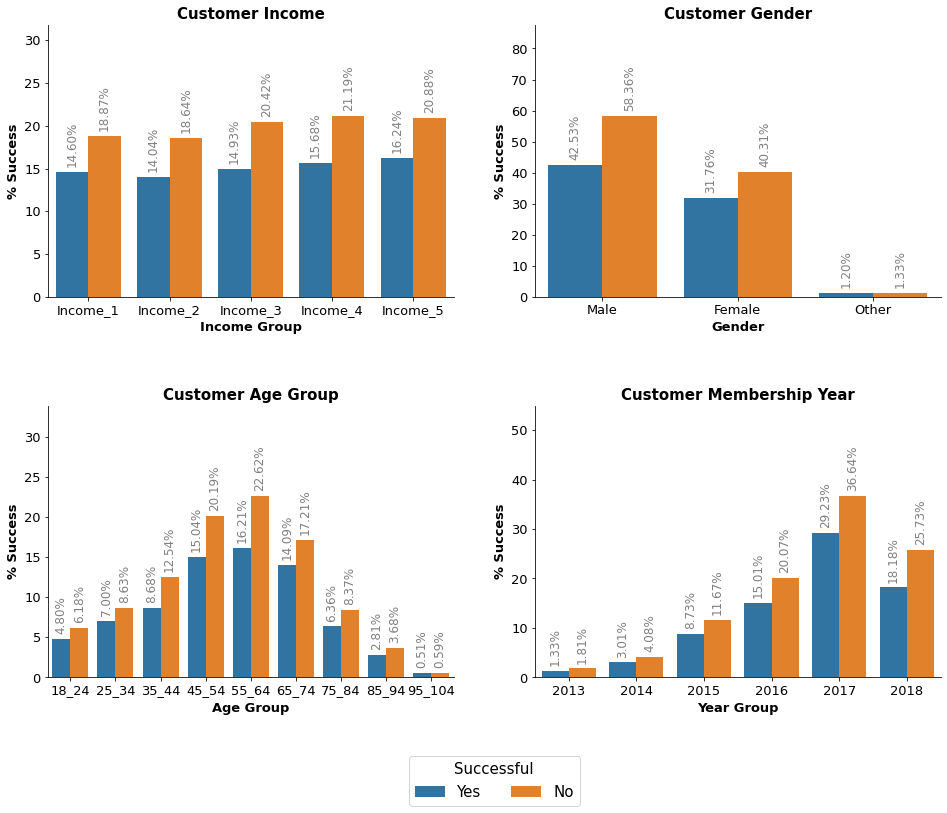
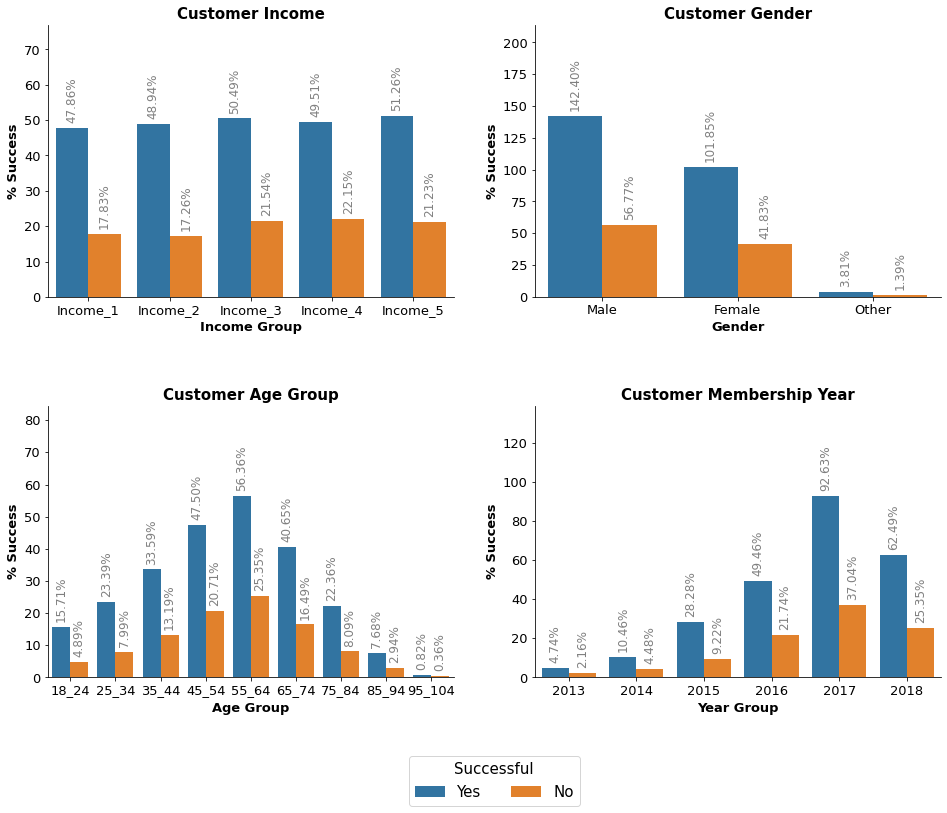
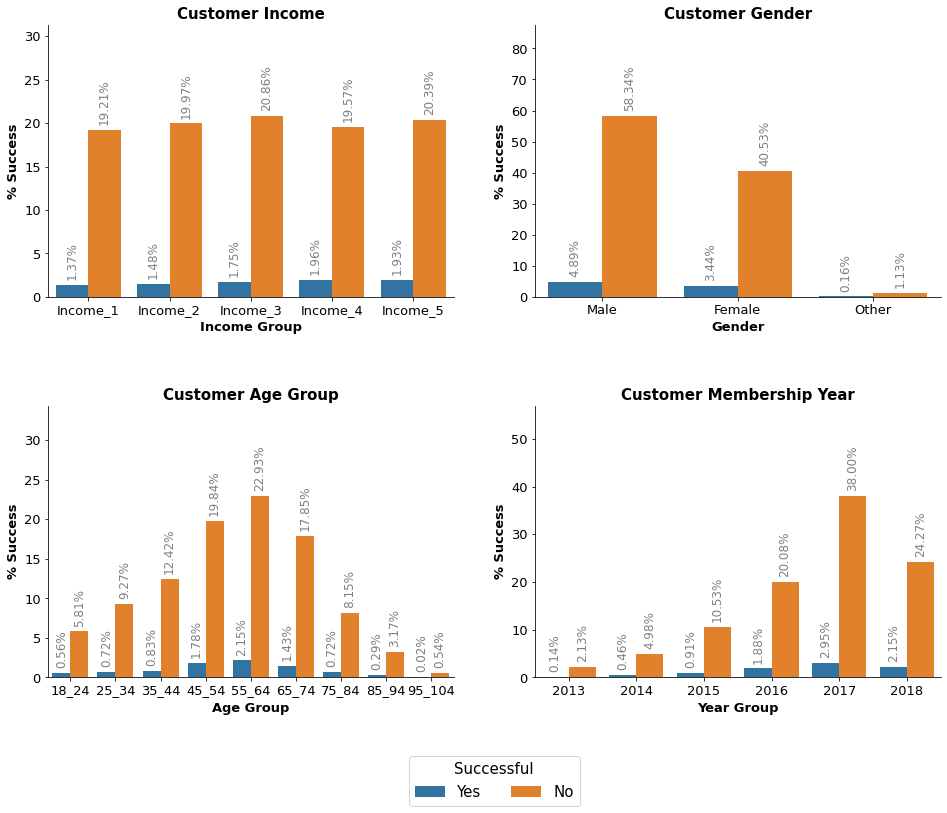
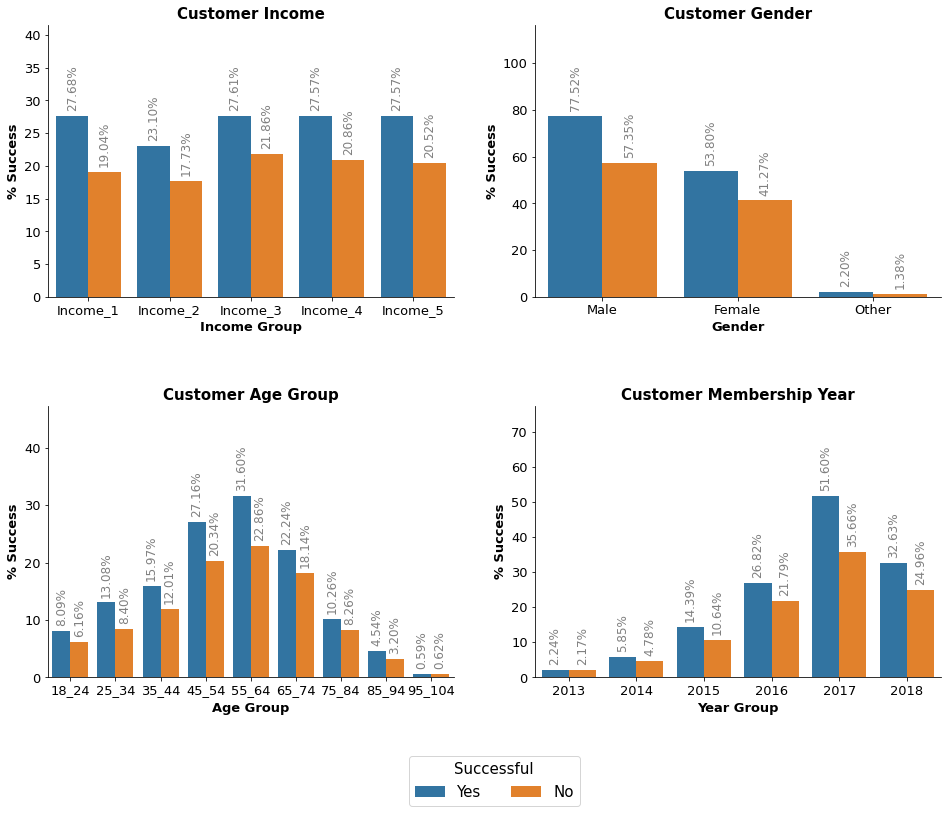
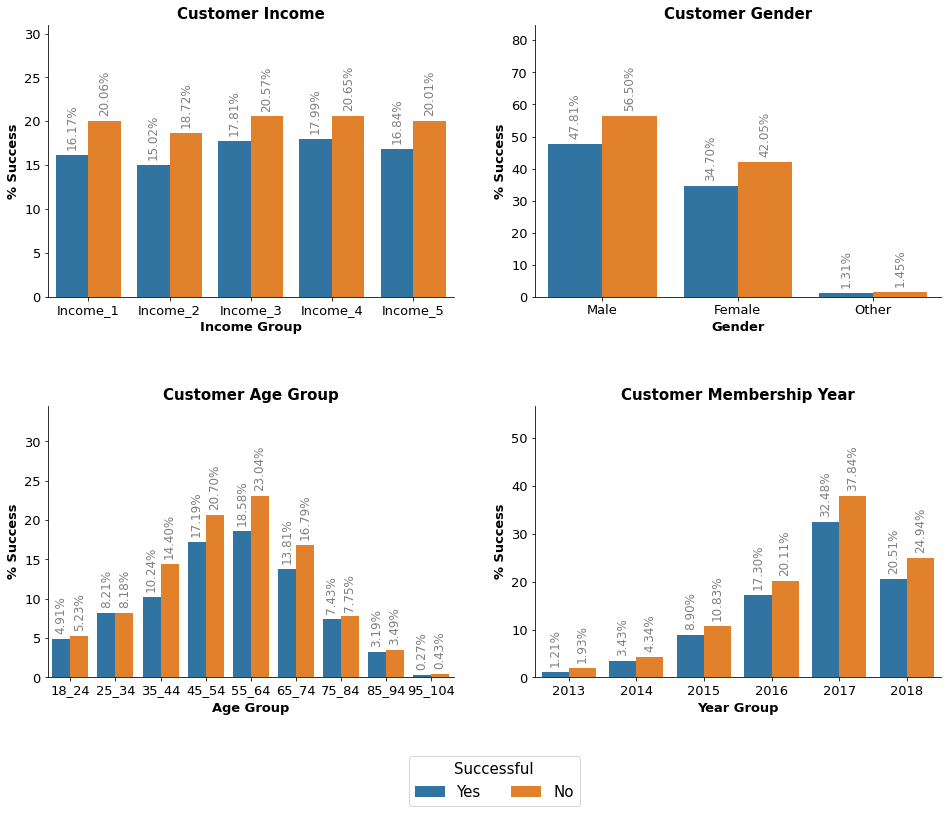
Observation: The results show quite an even distribution of offer success. However, things change for the last two results which are informational offers with just 9.6% and 7.8% offer success rates accordingly. Interestingly, males complete more offers than females despite being the minority of customers.
Modelling
The first step in a modelling process is to split our data into training and testing data. Generally, the rule of thumb is to divide the data in a way that variance is not too high with either training or testing data. However, 80/20 is a good starting point to start tweaking from. We also need to select some relevant features to train our model with.
Pre-processing
We will split our data into training and testing sets by using these variables:
X_train – includes the independent variables used to train the model. Since we have also specified the test_size = 0.2, this means 80% of observations from the complete dataset will be used to train/fit the model. The remaining 20% will be used to test the model.
X_test – the remaining 20% portion of the independent variables from the dataset which will not be used in the training phase and will be used to make predictions to test the accuracy of the model.
y_train – includes a dependent variable which needs to be predicted by the model. This will include category labels against our independent variables, but we need to specify our dependent variable while training/fitting the model.
y_test – includes category labels for our test data, these labels will be used to test the accuracy between actual and predicted categories.
Current features count: 30
Index(['offer_id', 'total_amount', 'difficulty', 'duration', 'reward', 'bogo',
       'discount', 'mobile', 'social', 'web', 'female', 'male', 'other',
       'member_days', 'income', '18_24', '25_34', '35_44', '45_54', '55_64',
       '65_74', '75_84', '85_94', '95_104', '2013', '2014', '2015', '2016',
       '2017', '2018'],
      dtype='object')
Offer Analysis
Offer 1 Analysis
| offer_id | difficulty | duration | reward | bogo | discount | informational | mobile | social | web | ||
|---|---|---|---|---|---|---|---|---|---|---|---|
| 0 | 1 | 10 | 7 | 10 | 1 | 0 | 0 | 1 | 1 | 1 | 0 |
Offer 1

- Offer Successful
  Average customer income: $65,812.46
  Average customer age: 54.12 years


- Offer Unsuccessful
  Average customer income: $65,410.56
  Average customer age: 54.41 years
Offer 2 Analysis
| offer_id | difficulty | duration | reward | bogo | discount | informational | mobile | social | web | ||
|---|---|---|---|---|---|---|---|---|---|---|---|
| 1 | 2 | 10 | 5 | 10 | 1 | 0 | 0 | 1 | 1 | 1 | 1 |
Offer 2

- Offer Successful
  Average customer income: $65,111.46
  Average customer age: 53.8 years


- Offer Unsuccessful
  Average customer income: $65,446.79
  Average customer age: 54.43 years
Offer 3 Analysis
| offer_id | difficulty | duration | reward | bogo | discount | informational | mobile | social | web | ||
|---|---|---|---|---|---|---|---|---|---|---|---|
| 2 | 3 | 0 | 4 | 0 | 0 | 0 | 1 | 1 | 1 | 0 | 1 |
Offer 3

- Offer Successful
  Average customer income: $66,520.61
  Average customer age: 53.58 years


- Offer Unsuccessful
  Average customer income: $65,420.53
  Average customer age: 54.4 years

Offer 4 Analysis
| offer_id | difficulty | duration | reward | bogo | discount | informational | mobile | social | web | ||
|---|---|---|---|---|---|---|---|---|---|---|---|
| 3 | 4 | 5 | 7 | 5 | 1 | 0 | 0 | 1 | 1 | 0 | 1 |
Offer 4

- Offer Successful
  Average customer income: $64,792.00
  Average customer age: 54.3 years


- Offer Unsuccessful
  Average customer income: $65,462.88
  Average customer age: 54.4 years
Offer 5 Analysis
| offer_id | difficulty | duration | reward | bogo | discount | informational | mobile | social | web | ||
|---|---|---|---|---|---|---|---|---|---|---|---|
| 4 | 5 | 20 | 10 | 5 | 0 | 1 | 0 | 1 | 0 | 0 | 1 |
Offer 5

- Offer Successful
  Average customer income: $65,779.17
  Average customer age: 54.91 years


- Offer Unsuccessful
  Average customer income: $65,415.31
  Average customer age: 54.37 years
Offer 6 Analysis
| offer_id | difficulty | duration | reward | bogo | discount | informational | mobile | social | web | ||
|---|---|---|---|---|---|---|---|---|---|---|---|
| 5 | 6 | 7 | 7 | 3 | 0 | 1 | 0 | 1 | 1 | 1 | 1 |
Offer 6

- Offer Successful
  Average customer income: $65,169.09
  Average customer age: 54.64 years


- Offer Unsuccessful
  Average customer income: $65,450.09
  Average customer age: 54.38 years

Offer 7 Analysis
| offer_id | difficulty | duration | reward | bogo | discount | informational | mobile | social | web | ||
|---|---|---|---|---|---|---|---|---|---|---|---|
| 6 | 7 | 10 | 10 | 2 | 0 | 1 | 0 | 1 | 1 | 1 | 1 |
Offer 7

- Offer Successful
  Average customer income: $65,440.71
  Average customer age: 54.11 years


- Offer Unsuccessful
  Average customer income: $65,430.38
  Average customer age: 54.42 years
Offer 8 Analysis
| offer_id | difficulty | duration | reward | bogo | discount | informational | mobile | social | web | ||
|---|---|---|---|---|---|---|---|---|---|---|---|
| 7 | 8 | 0 | 3 | 0 | 0 | 0 | 1 | 1 | 1 | 1 | 0 |
Offer 8

- Offer Successful
  Average customer income: $67,652.91
  Average customer age: 54.76 years


- Offer Unsuccessful
  Average customer income: $65,413.59
  Average customer age: 54.39 years
Offer 9 Analysis
| offer_id | difficulty | duration | reward | bogo | discount | informational | mobile | social | web | ||
|---|---|---|---|---|---|---|---|---|---|---|---|
| 8 | 9 | 5 | 5 | 5 | 1 | 0 | 0 | 1 | 1 | 1 | 1 |
Offer 9

- Offer Successful
  Average customer income: $65,428.98
  Average customer age: 54.1 years


- Offer Unsuccessful
  Average customer income: $65,431.24
  Average customer age: 54.41 years
Offer 10 Analysis
| offer_id | difficulty | duration | reward | bogo | discount | informational | mobile | social | web | ||
|---|---|---|---|---|---|---|---|---|---|---|---|
| 9 | 10 | 10 | 7 | 2 | 0 | 1 | 0 | 1 | 1 | 0 | 1 |
Offer 10

- Offer Successful
  Average customer income: $65,535.19
  Average customer age: 54.45 years


- Offer Unsuccessful
  Average customer income: $65,426.10
  Average customer age: 54.39 years
Building Models
To find the best model I’ve prepared a function below which takes a selection of models that might work well with the dataset. The function will test each of the models and return the accuracy, precision, recall, f1-score and support per model. We are going to test fit 5 different models on our dataset. The models chosen are:
- Logistic Regression: basic linear classifier (a good baseline model)
- Random Forest: ensemble bagging classifier
- K-Nearest Neighbors: instance based classifier
- Gaussian Naive Bayes: probabilistic classifier
- XGBoost: ensemble (extreme!) boosting classifier
I have omitted SVM because it had one of the worst performing models and was slow to train/score. For the initial experiements, I used the default parameters for each model. To get better results for the fit of each model, we’ll need to fine tune the parameters later.
Our function will create a new dataset from the application of 5-fold cross validation on our training set. However, the metrics recorded here are weighted mean metrics across both classes. This may not work well if our dataset is imbalanced as performance on the majority class will overshadow the minority class. If this is the case, we may need to further tweak the code. We can also modifiy our function to record only the metrics for the classes of interest!
LogReg
              precision    recall  f1-score   support

unsuccessful       0.85      0.93      0.89      7561
  successful       0.91      0.80      0.85      6062

    accuracy                           0.88     13623
   macro avg       0.88      0.87      0.87     13623
weighted avg       0.88      0.88      0.87     13623

RF
              precision    recall  f1-score   support

unsuccessful       0.92      0.90      0.91      7561
  successful       0.88      0.90      0.89      6062

    accuracy                           0.90     13623
   macro avg       0.90      0.90      0.90     13623
weighted avg       0.90      0.90      0.90     13623

KNN
              precision    recall  f1-score   support

unsuccessful       0.82      0.88      0.85      7561
  successful       0.83      0.76      0.79      6062

    accuracy                           0.82     13623
   macro avg       0.83      0.82      0.82     13623
weighted avg       0.82      0.82      0.82     13623

GNB
              precision    recall  f1-score   support

unsuccessful       0.74      0.87      0.80      7561
  successful       0.79      0.61      0.69      6062

    accuracy                           0.76     13623
   macro avg       0.76      0.74      0.74     13623
weighted avg       0.76      0.76      0.75     13623

XGB
              precision    recall  f1-score   support

unsuccessful       0.93      0.90      0.91      7561
  successful       0.88      0.91      0.89      6062

    accuracy                           0.90     13623
   macro avg       0.90      0.90      0.90     13623
weighted avg       0.90      0.90      0.90     13623
Evaluating the results
To complete our analysis, we need to analyze the data in the final dataframe returned from the run_exps() script. To obtain better estimates of the distribution of metrics from each model, we need to run empirical bootstrapping at 30 samples using the code below. Additionally, we should partition the data into two groups:
- performance metrics
- fit-time metrics
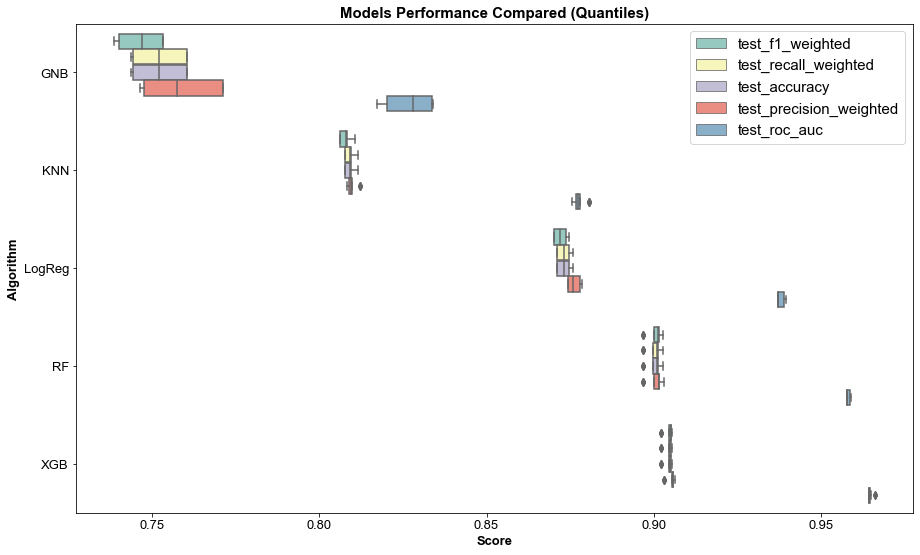


Observation: From this plot we can see the best performing model appears to be XGBoost, followed by Logistic Regression and Random Forest. The differences are very small though. KNN was the fastest model to fit but also the took the longest to score by a large margin, the score times of the other models are extremely short. There seems to be a correlation between the length of time taken to fit the model and model performance as slower fitting models seem to perform better. The exception is Random Forest which takes the longest to fit but still ends up as the third-best performing model. From our findings, I would suggest continuing to refine the XGBoost model since it trains and performs the best of all the models.
Next, we can do further analysis on the models by finding the means and stds for each metric.
Assessing Models

Observation: It looks like our model is learning alot until 15-20 iterations, we can tune our model to increase it’s performance.
New Model
Wall time: 1.21 s
Accuracy: 90.53%
F1 Score: 89.53%

Training Accuracy: 91.40%
Training F1 Score: 90.58%

Old Model (joblib)
Wall time: 1.42 s
Accuracy: 90.33%
F1 Score: 89.33%

Training Accuracy: 92.62%
Training F1 Score: 91.92%

New Model Accuracy + 0.2 % higer
New Model F1-score + 0.2 % higher
Observation: It seems we have tuned this model very well out of the box so we don’t have much room for improvement here. I have tried using RandomSearchCV to find the best parameters but the results are identical to our manually tuned model. We can enable verbose=True to get more information about each models’ performance.
Evaluation
We’ve explored the customer data and you’ve found patterns, and now we have to ask: Are the results any good? It’s time to evaluate not just the models we have created, but also the process that we used to create them and their potential for practical use.
Evaluating Results
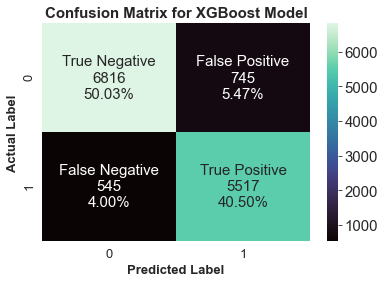
True Positives (TP): we correctly predicted that a customer will respond to an offer 5517 times
True Negatives (TN): we correctly predicted that a customer will not respond to an offer 6816 times
False Positives (FP): we incorrectly predicted that a customer will respond to an offer 745 times
False Negatives (FN): we incorrectly predicted that a customer will not respond to an offer 545 times
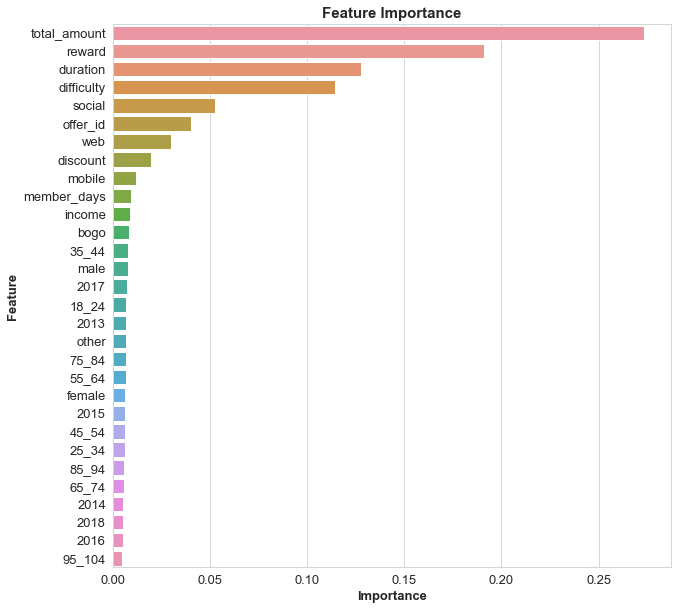
Feature Importance
| feature_name | feature_importance | |
|---|---|---|
| 0 | total_amount | 0.273585 |
| 1 | reward | 0.190774 |
| 2 | duration | 0.127873 |
| 3 | difficulty | 0.114080 |
| 4 | social | 0.052473 |
| 5 | offer_id | 0.040354 |
| 6 | web | 0.030136 |
| 7 | discount | 0.019436 |
| 8 | mobile | 0.011611 |
| 9 | member_days | 0.009363 |
Reviewing the process
We wanted to find out if a customer would respond to an offer by building a model that predicts just that.
Step 1: The first step was to evaluate the data we had to work with. We had three json files to work with, portfolio.json – includes offer meta data, profile.json – includes demographic data for each customer, and transcript – includes records for trasactions, offers viewed/received/completed.
Step 2: The second step was to convert each dataset to DataFrames before exploring and cleaning them in preparation to combining them. I saved the cleaned DataFrame as a csv file before splitting into training and testing sets. Next, I scaled the X_train and X_test arrays to minimise bias to prepare for fitting them into a suitable algorithm.
Step 3: I used a special function to loop over various selected algorithms to see how each compares with the model I fit. From the results RF and XGBoost scored very well so I continued fine tuning XGBoost using RandomSearchCV to find the best parameters to use on our model. I saved the model files and continued to further evaluate training quality by looking at the Logloss and Classification Errors. I also looked at the Confusion Matrix and Feature Importance of the model to make sure it can accuratly classify each prediction. My analysis returned training data scores of
- Training Accuracy: 92.42%
- Training F1 Score: 91.70%
Step 4: Look at other ways to evaluate the model and determine if it is overfitting or underfitting.
Step 5: Feature Importance as discussed earlier refers to a numerical value used to describe the predictive power of each feature in the dataset. This is used to determine which features will provide the best fit for the model so accurate predictions can be made. This is importance, since variable selection is quite difficult. The top 5 importances are:
total_amount– amount spent by the customerreward– reward given for completing an offeroffer_duration– time for offer to be openoffer_difficulty– minimum required spend to complete an offersocial– the offer was received on a social channel
Determining the next steps
The top 5 features are directly related with whether a customer will complete an offer, in this case it may be possible to improve the performance of our XGBoost model by creating new features using Feature Creation. This may help our model understand more without increasing the complexity of our model. We could also remove features to find results on how certain offers perform when shown to customers.
Conclusion
Can we create a Machine Learning model to predict if a customer will respond to an offer?
Yes. From our results, we can see our model is extremely accurate. The fact that the correlations match the feature importance is a good indication.
What factors affect offer success?
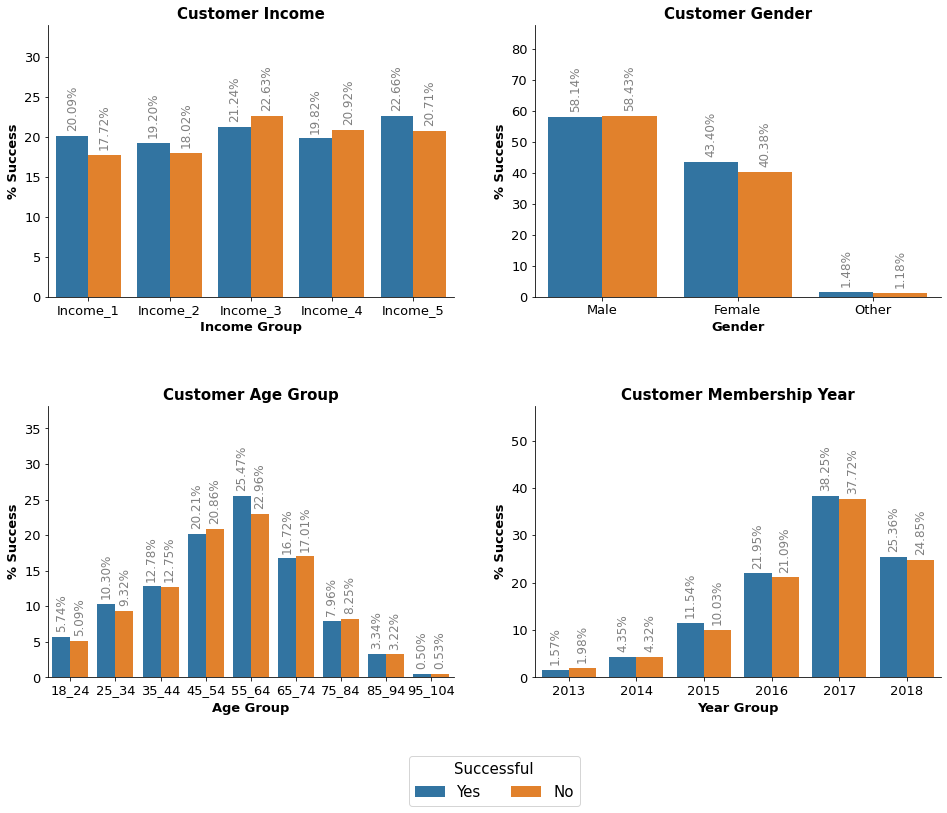
Total amount is the most important feature for our model just like our correlation heat map, but interestingly rewards and duration are second and third on feature importance. We also found that the length of time a customer has been a member makes the customer more likely to complete an offer. Gender and income also have slight effect on offer success. We could develop and deploy a machine learning pipeline to customise offers depending on transaction history from each customer. From all the information we have I would recommend:
- Long term customers get different offers than new customers
- Inactive customers may recieve offers to drive action
How do those factors affect offer success?
Looking at the feature importance offer success we can see all the factors that affect if an offer will be successful. From our observations above we can conclude:
- Total amount: The total amount spent has the most dramatic effect on determining if an offer will be successful, this should be obvious since people who have completed an offer would have to spend money
- Reward: Reward determines the amount of money a customer will save if they qualify for an offer, it makes sense that this would directly affect offer success
- Duration: Duration of the offer has a big effect of offer success most likely because the informational offers have a shorter duration unlike the discount and BOGO offers
Now, we can discuss what worked and what didn’t and what would be good to do again or what should be avoided.
- What worked?
Feature engineering – I added a variablemember_dayswhich helped improve the predictive performance of our model - What didn’t work?
I tried using Log Transformation onX_trainandX_testbut the 0 values caused -inf issues - What would be good to do again?
The function used to automatically fit our data using various algorithms, this saves a lot of time - What should be avoided?
Spending too much time on complex analysis
References:
https://appdividend.com/2019/11/16/how-to-find-element-in-list-in-python/
https://datascience.stackexchange.com/questions/28426/train-accuracy-vs-test-accuracy-vs-confusion-matrix
https://datatofish.com/if-condition-in-pandas-dataframe/
https://datavizpyr.com/annotate-barplot-with-bar_label-in-matplotlib/
https://dev.to/thalesbruno/subplotting-with-matplotlib-and-seaborn-5ei8
https://discuss.tvm.apache.org/t/parameters-silent-might-not-be-used/6753/5
https://github.com/DTrimarchi10/confusion_matrix
https://github.com/tqdm/tqdm#parameters
https://humansofdata.atlan.com/2018/03/when-delete-outliers-dataset/
https://jakevdp.github.io/PythonDataScienceHandbook/04.08-multiple-subplots.html
https://kanoki.org/2019/04/06/pandas-map-dictionary-values-with-dataframe-columns/
https://machinelearningmastery.com/calculate-feature-importance-with-python/
https://machinelearningmastery.com/calculate-the-bias-variance-trade-off/
https://machinelearningmastery.com/feature-importance-and-feature-selection-with-xgboost-in-python/
https://machinelearningmastery.com/save-load-machine-learning-models-python-scikit-learn/
https://matplotlib.org/1.3.1/users/legend_guide.html
https://matplotlib.org/stable/api/as_gen/matplotlib.pyplot.legend.html https://matplotlib.org/stable/api/_as_gen/matplotlib.pyplot.subplots_adjust.html#matplotlib.pyplot.subplots_adjust https://medium.com/@dtuk81/confusion-matrix-visualization-fc31e3f30fea https://medium.com/analytics-vidhya/mastering-pandas-indexing-loc-iloc-47ee22b009db https://medium.com/quick-code/regression-versus-classification-machine-learning-whats-the-difference-345c56dd15f7 https://newbedev.com/how-to-position-suptitle https://numpy.org/doc/stable/reference/generated/numpy.r.html
https://numpy.org/doc/stable/reference/generated/numpy.transpose.html
https://pandas.pydata.org/docs/reference/api/pandas.Series.between.html
https://pandas.pydata.org/docs/reference/api/pandas.cut.html
https://pandas.pydata.org/pandas-docs/version/0.13.1/visualization.html
https://pythonexamples.org/pandas-dataframe-fillna/
https://re-thought.com/how-to-add-new-columns-in-a-dataframe-in-pandas/
https://realpython.com/pandas-groupby/
https://realpython.com/pandas-settingwithcopywarning/
https://realpython.com/train-test-split-python-data/
https://scikit-learn.org/stable/modules/generated/sklearn.model_selection.RandomizedSearchCV.html
https://scikit-learn.org/stable/modules/generated/sklearn.preprocessing.MinMaxScaler.html
https://scikit-learn.org/stable/modules/preprocessing.html
https://seaborn.pydata.org/tutorial/categorical.html
https://stackabuse.com/python-check-if-string-contains-substring/
https://stackoverflow.com/questions/1221108/barchart-with-vertical-labels-in-python-matplotlib
https://stackoverflow.com/questions/13610074/is-there-a-rule-of-thumb-for-how-to-divide-a-dataset-into-training-and-validatio
https://stackoverflow.com/questions/13611065/efficient-way-to-apply-multiple-filters-to-pandas-dataframe-or-series
https://stackoverflow.com/questions/15704280/python-loop-through-a-range-of-variables/15704360
https://stackoverflow.com/questions/18889588/create-dummies-from-column-with-multiple-values-in-pandas
https://stackoverflow.com/questions/21415661/logical-operators-for-boolean-indexing-in-pandas
https://stackoverflow.com/questions/26762100/reconstruct-a-categorical-variable-from-dummies-in-pandas
https://stackoverflow.com/questions/26837998/pandas-replace-nan-with-blank-empty-string
https://stackoverflow.com/questions/27975069/how-to-filter-rows-containing-a-string-pattern-from-a-pandas-dataframe
https://stackoverflow.com/questions/30405413/python-pandas-extract-year-from-datetime-dfyear-dfdate-year-is-not-wo
https://stackoverflow.com/questions/34674797/xgboost-xgbclassifier-defaults-in-python
https://stackoverflow.com/questions/35321812/move-column-in-pandas-dataframe
https://stackoverflow.com/questions/3877491/deleting-rows-in-numpy-arrayX_test.shape
https://stackoverflow.com/questions/38807895/seaborn-multiple-barplots/38808042
https://stackoverflow.com/questions/39602824/pandas-replace-string-with-another-string
https://stackoverflow.com/questions/40088585/turn-off-error-bars-in-seaborn-bar-plot
https://stackoverflow.com/questions/42145340/using-lambda-conditional-and-pandas-str-contains-to-lump-strings
https://stackoverflow.com/questions/42331992/replace-part-of-the-string-in-pandas-data-frame
https://stackoverflow.com/questions/43214978/seaborn-barplot-displaying-values
https://stackoverflow.com/questions/44116194/import-a-function-from-another-ipynb-file
https://stackoverflow.com/questions/46173419/seaborn-change-bar-colour-according-to-hue-name
https://stackoverflow.com/questions/51424312/how-to-save-gridsearchcv-object
https://stackoverflow.com/questions/51626360/unexpected-behavior-from-xgboost-in-python-with-custom-evaluation-function
https://stackoverflow.com/questions/54933804/how-to-get-actual-feature-names-in-xgboost-feature-importance-plot-without-retra
https://stackoverflow.com/questions/55257957/removing-brackets-from-list-inside-pandas-cell
https://stackoverflow.com/questions/56212429/how-to-remerge-the-x-test-and-the-y-test-the-x-train-and-the-y-train-after-spl
https://stackoverflow.com/questions/56304562/numpy-float64-object-is-not-callable-in-aucrecall-precision
https://stackoverflow.com/questions/58119448/how-to-store-a-dataframe-in-a-dictionary
https://stackoverflow.com/questions/58823264/how-to-scale-train-validation-and-test-sets-properly-using-standardscaler
https://stackoverflow.com/questions/59024250/suppress-warningmatplotlib-legendno-handles-with-labels-found-to-put-in-legend
https://stackoverflow.com/questions/68320207/how-to-get-the-label-values-on-a-bar-chat-with-seaborn-on-a-categorical-data
https://thispointer.com/python-capitalize-the-first-letter-of-each-word-in-a-string/
https://towardsdatascience.com/all-about-feature-scaling-bcc0ad75cb35
https://towardsdatascience.com/an-extensive-guide-to-exploratory-data-analysis-ddd99a03199e
https://towardsdatascience.com/conditional-probability-with-a-python-example-fd6f5937cd2
https://towardsdatascience.com/crisp-dm-methodology-for-your-first-data-science-project-769f35e0346c
https://towardsdatascience.com/how-to-convert-json-into-a-pandas-dataframe-100b2ae1e0d8
https://towardsdatascience.com/how-to-evaluate-your-machine-learning-models-with-python-code-5f8d2d8d945b
https://towardsdatascience.com/introduction-to-data-preprocessing-in-machine-learning-a9fa83a5dc9d
https://towardsdatascience.com/quickly-test-multiple-models-a98477476f0
https://towardsdatascience.com/xgboost-fine-tune-and-optimize-your-model-23d996fab663
https://www.analyticsvidhya.com/blog/2020/04/feature-scaling-machine-learning-normalization-standardization/
https://www.analyticsvidhya.com/blog/2020/10/feature-selection-techniques-in-machine-learning/
https://www.codegrepper.com/code-examples/python/sns+heatmap+annot+large+number+format
https://www.datacamp.com/community/tutorials/converting-strings-datetime-objects
https://www.delftstack.com/howto/matplotlib/how-to-make-a-single-legend-for-all-subplots-in-matplotlib/
https://www.dummies.com/programming/big-data/data-science/choosing-right-algorithm-machine-learning/
https://www.dummies.com/programming/big-data/data-science/data-mining-for-dummies-cheat-sheet/
https://www.dummies.com/programming/big-data/data-science/machine-learning-creating-features-data/
https://www.geeksforgeeks.org/capitalize-first-letter-of-a-column-in-pandas-dataframe/
https://www.geeksforgeeks.org/how-to-calculate-the-percentage-of-a-column-in-pandas/
https://www.geeksforgeeks.org/how-to-move-a-column-to-first-position-in-pandas-dataframe/
https://www.geeksforgeeks.org/how-to-remove-the-legend-in-matplotlib/
https://www.geeksforgeeks.org/iterate-over-a-list-in-python/
https://www.geeksforgeeks.org/python-pandas-melt/
https://www.geeksforgeeks.org/python-pandas-series-ravel/
https://www.geeksforgeeks.org/python-pandas-series-str-get_dummies/
https://www.geeksforgeeks.org/python-ways-to-convert-boolean-values-to-integer/
https://www.kaggle.com/parulpandey/five-ways-to-use-value-counts
https://www.kite.com/python/answers/how-to-save-and-read-a-list-in-python
https://www.kite.com/python/answers/how-to-set-axis-limits-in-a-seaborn-lmplot-facetgrid-in-python
https://www.marsja.se/how-to-convert-numpy-array-to-pandas-dataframe-examples/
https://www.marsja.se/transform-skewed-data-using-square-root-log-box-cox-methods-in-python/
https://www.pluralsight.com/guides/cleaning-up-data-from-outliers
https://www.python-graph-gallery.com/92-control-color-in-seaborn-heatmaps
https://www.quora.com/How-can-I-replace-characters-in-a-multiple-column-name-in-pandas
https://www.reddit.com/r/learnpython/comments/45c9kw/adding_or_in_python_without_space_in_between_the/
https://www.ritchieng.com/machine-learning-evaluate-classification-model/
https://www.snapsurveys.com/blog/5-survey-demographic-question-examples/
https://www.youtube.com/watch?v=5bHpPQ6_OU4&ab_channel=Simplilearn

