
Introduction
Welcome to the exciting world of Forex trading! While it can be thrilling, it’s important to recognize that Forex trading isn’t easy. Success in today’s market requires the ability to test strategies, automate trading, and access crucial information efficiently.
In this project, we’ll be provided with the foundation to thrive in the Forex market. We’ll be using the Oanda API service, a powerful tool available in most countries worldwide.
This project will require us to:
- Build a live trading bot
- Develop a fast and accurate strategy testing system
- Retrieve live market data including headlines, sentiments, and technicals
- Utilize databases to store and analyze market data
- Create a web application displaying real-time market information
- Master full-stack development using MongoDB, Python, and JavaScript (with React)
We’ll kickstart our journey by learning how to use Python to access the Oanda REST API. From there, we’ll dive into strategy testing, backtesting, and automation. We’ll progressively advance to more complex strategies, including candle pattern detection and indicator calculation.
As our knowledge grows, we’ll develop a comprehensive backtesting system, evaluating popular strategies touted online. Then, we’ll embark on the creation of a robust live trading bot, capable of trading multiple currency pairs with ease.
In the advanced stages of the project, we’ll explore real-time price streaming, leveraging multi-threading techniques for faster decision-making. Additionally, we’ll delve into web scraping to gather live market data and set up a MongoDB database for efficient data management.
To culminate our journey, we’ll harness the power of React to build a dynamic web application showcasing live market prices and sentiment data. Finally, we’ll deploy our trading bot on a cloud service, ensuring seamless operation in real-world conditions.
Let’s get ready to embark on an exhilarating journey into the world of Forex trading, where we’ll gain invaluable skills and knowledge to thrive in the competitive market landscape. Let’s dive in!
Step 1 – Oanda account setup and API access
Before starting the course, it’s essential to set up an account with a broker, in this case, Oanda, and access their API for trading. Oanda is chosen for its popular use in courses and its comprehensive API. To create an account, visit Oanda’s website and follow the process for setting up a demo trading account via their API documentation. Ensure to select the appropriate account type, FX trade account, to access the API. Be aware of potential restrictions based on location, especially for EU residents.
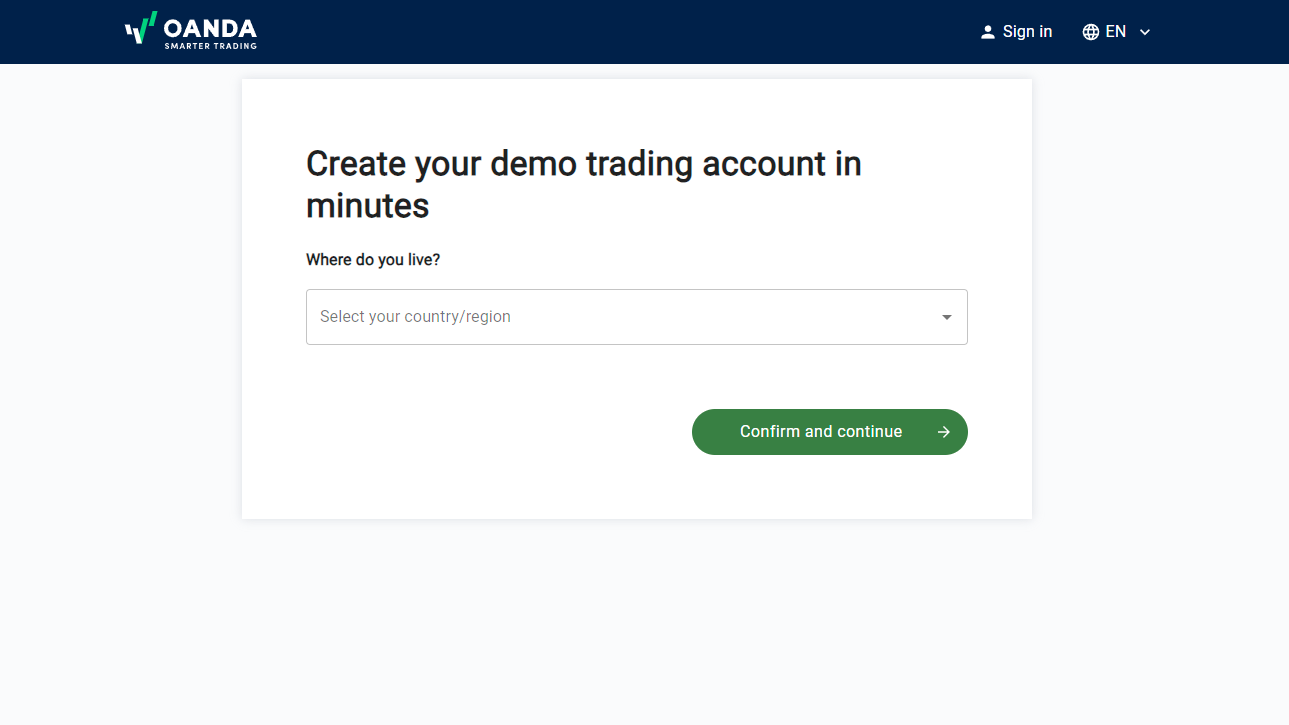
Once the account is created, log in, generate an API key, and note down the account number associated with the demo account. These credentials will be necessary for accessing and using the API throughout the course.
Step 2 – Environment Setup
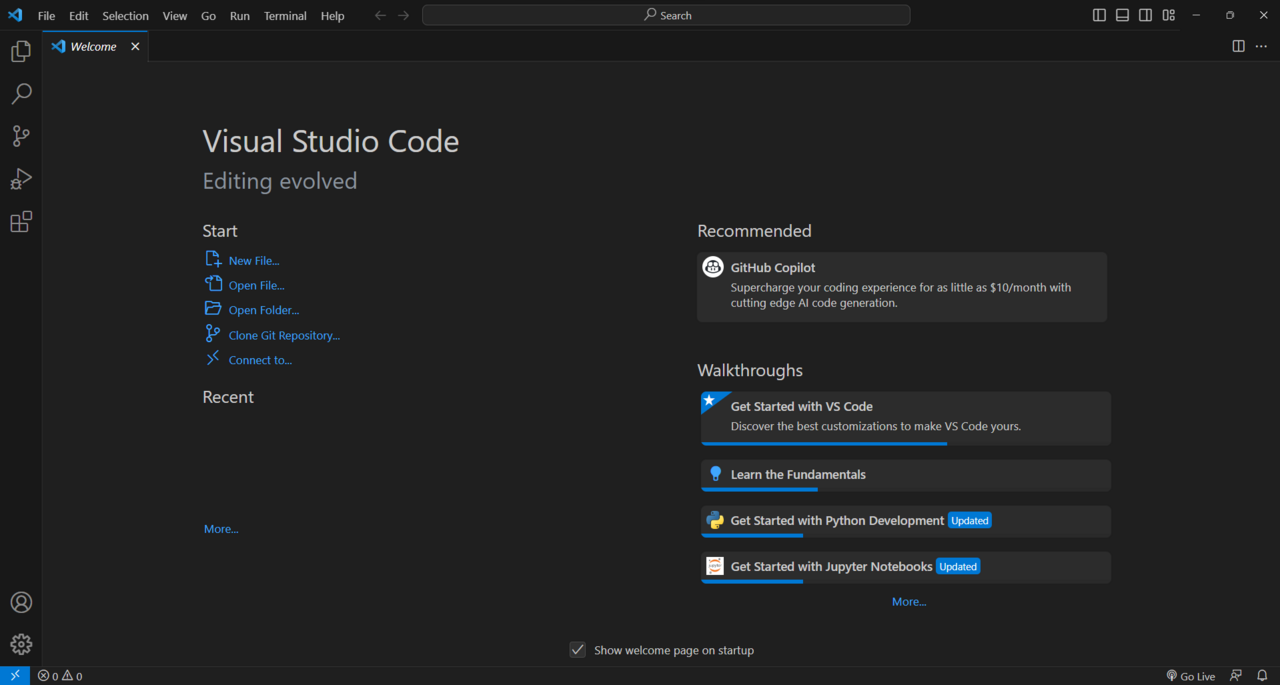
To set up our development environment, we first install Python 3.6 or greater, creating virtual environments to manage dependencies. Next, we install Visual Studio Code and essential extensions for Python development. Finally, we download and install Postman for testing API requests. With these steps completed, our development environment is ready for the project.
Step 3 – The Oanda API
In this section, we explore the functionality of the Oanda API, a vital tool for accessing financial data and executing trades programmatically. We start with a brief introduction to the API’s significance in algorithmic trading. Next, we cover the documentation and authorization process, essential for accessing its endpoints.
We then dive into specific endpoints such as Accounts, Account Summary, Account Instruments, Instrument Candles, and Pricing. These endpoints allow us to interact with trading accounts, retrieve account information, access financial instruments, analyze historical price data, and obtain real-time market prices, respectively.
Understanding and mastering these endpoints is crucial for developing effective trading strategies and staying informed about market movements. By leveraging the Oanda API’s capabilities, we can enhance our trading systems and make informed decisions in the dynamic Forex market.
Below is an example of setting up the Oanda API using Python.
import oandapy

# Initialize Oanda API client
oanda = oandapy.API(environment="practice", access_token="YOUR_API_KEY")

# Retrieve historical data
instrument = "EUR_USD"
granularity = "D"
start_date = "2022-01-01"
end_date = "2022-12-31"

historical_data = oanda.get_history(instrument=instrument, granularity=granularity, start=start_date, end=end_date)
Step 4: Fetching Candles
- Understanding Candlestick Data: Candlestick charts provide a visual representation of price movements over a specific time period. Each candlestick represents a unit of time (e.g., 5 minutes, 1 hour) and contains information about the opening, closing, highest, and lowest prices during that period. These data points are crucial for analyzing market trends and making informed trading decisions.
- Oanda REST API and Instruments Candles Endpoint: Oanda offers an API that allows developers to access various financial data, including candlestick data. Specifically, we’ll use the
InstrumentsCandlesendpoint to retrieve candlestick information for a specified instrument (currency pair). - Python Implementation: To fetch candlestick data using Python, follow these steps:
- API Authentication: Obtain an API key from Oanda to authenticate your requests.
- HTTP Requests: Use Python’s
requestslibrary to send HTTP GET requests to thev3/instruments/{instrument}/candlesendpoint. - Query Parameters:
instrument: Specify the currency pair (e.g., EUR/USD, GBP/JPY).params: Optional query parameters (e.g., count, granularity).- Example params:
{ "count": 5, "granularity": "M5" }
- Example params:
- Response Format: The API response will include candle data in the following format:
{
    "candles": [
        {
            "volume": 132,
            "mid": {
                "h": "10508.0",
                "c": "10506.0",
                "l": "10503.8",
                "o": "10503.8"
            },
            "complete": true,
            "time": "2016-10-17T19:35:00.000000000Z"
        },
        # ... more candle data ...
    ],
    "granularity": "M5",
    "instrument": "DE30/EUR"
}
- Each candle includes volume, high (h), close ©, low (l), open (o) prices, and a timestamp.
- The
granularityspecifies the time interval (e.g., M5 for 5-minute candles).
Step 5: Strategy Testing, Back-testing and Automation
1. The Moving Average Crossover strategy

The Moving Average Crossover strategy is a popular technique used in technical analysis to identify potential trend changes. It involves two types of moving averages:
- Simple Moving Average (SMA): The SMA calculates the average price over a specified period. It smooths out price fluctuations and provides a trend-following signal.
- Exponential Moving Average (EMA): The EMA gives more weight to recent prices, making it more responsive to recent market movements.
How It Works
- Bullish Signal:
- When the shorter-term SMA (e.g., 50-day) crosses above the longer-term SMA (e.g., 200-day), it generates a bullish signal.
- This suggests that the trend is turning upward, indicating a potential buying opportunity.
- Bearish Signal:
- Conversely, when the shorter-term SMA crosses below the longer-term SMA, it generates a bearish signal.
- This indicates a potential downtrend, signalling a possible selling opportunity.
2. Strategy Implementation in Python
Once you have historical candlestick data (which we fetched from the Oanda API), it’s time to translate your trading strategy into Python code. Here’s how to proceed:
- Define Your Strategy: Clearly articulate your trading rules. Are you following a trend-following strategy, mean-reversion approach, or a combination of both? Consider factors like entry signals, exit criteria, and risk management.
- Coding the Strategy: Write Python functions or classes that encapsulate your strategy logic. For example:
def moving_average_crossover_strategy(df, short_window=50, long_window=200):
    # Calculate moving averages
    df['SMA_short'] = df['Close'].rolling(window=short_window).mean()
    df['SMA_long'] = df['Close'].rolling(window=long_window).mean()

    # Generate buy/sell signals
    df['Signal'] = 0
    df.loc[df['SMA_short'] > df['SMA_long'], 'Signal'] = 1  # Buy signal
    df.loc[df['SMA_short'] < df['SMA_long'], 'Signal'] = -1  # Sell signal

    return df
Step 6: Calculate Trading Indicators
In this section, we’re delving into Forex indicators and how to calculate them. I’ve searched for the most popular indicators on Google, which are statistical calculations based on price data. These indicators aim to assist in making trading decisions by predicting market trends.
For instance, I’ve opened the US dollar one-hour candles and examined the Relative Strength Index (RSI), a popular indicator. After adjusting the graph’s colours and thickness, I plotted the RSI for 14 periods. Depending on how one intends to use this indicator, it might provide an indication of whether to buy or sell, thereby potentially increasing profitability.
In this section, we’re going to do three main things. First, we’re going to cover some of the most popular indicators. With the knowledge of the inner workings, we can code and techniques to calculate and build pretty much any indicator we want from scratch.
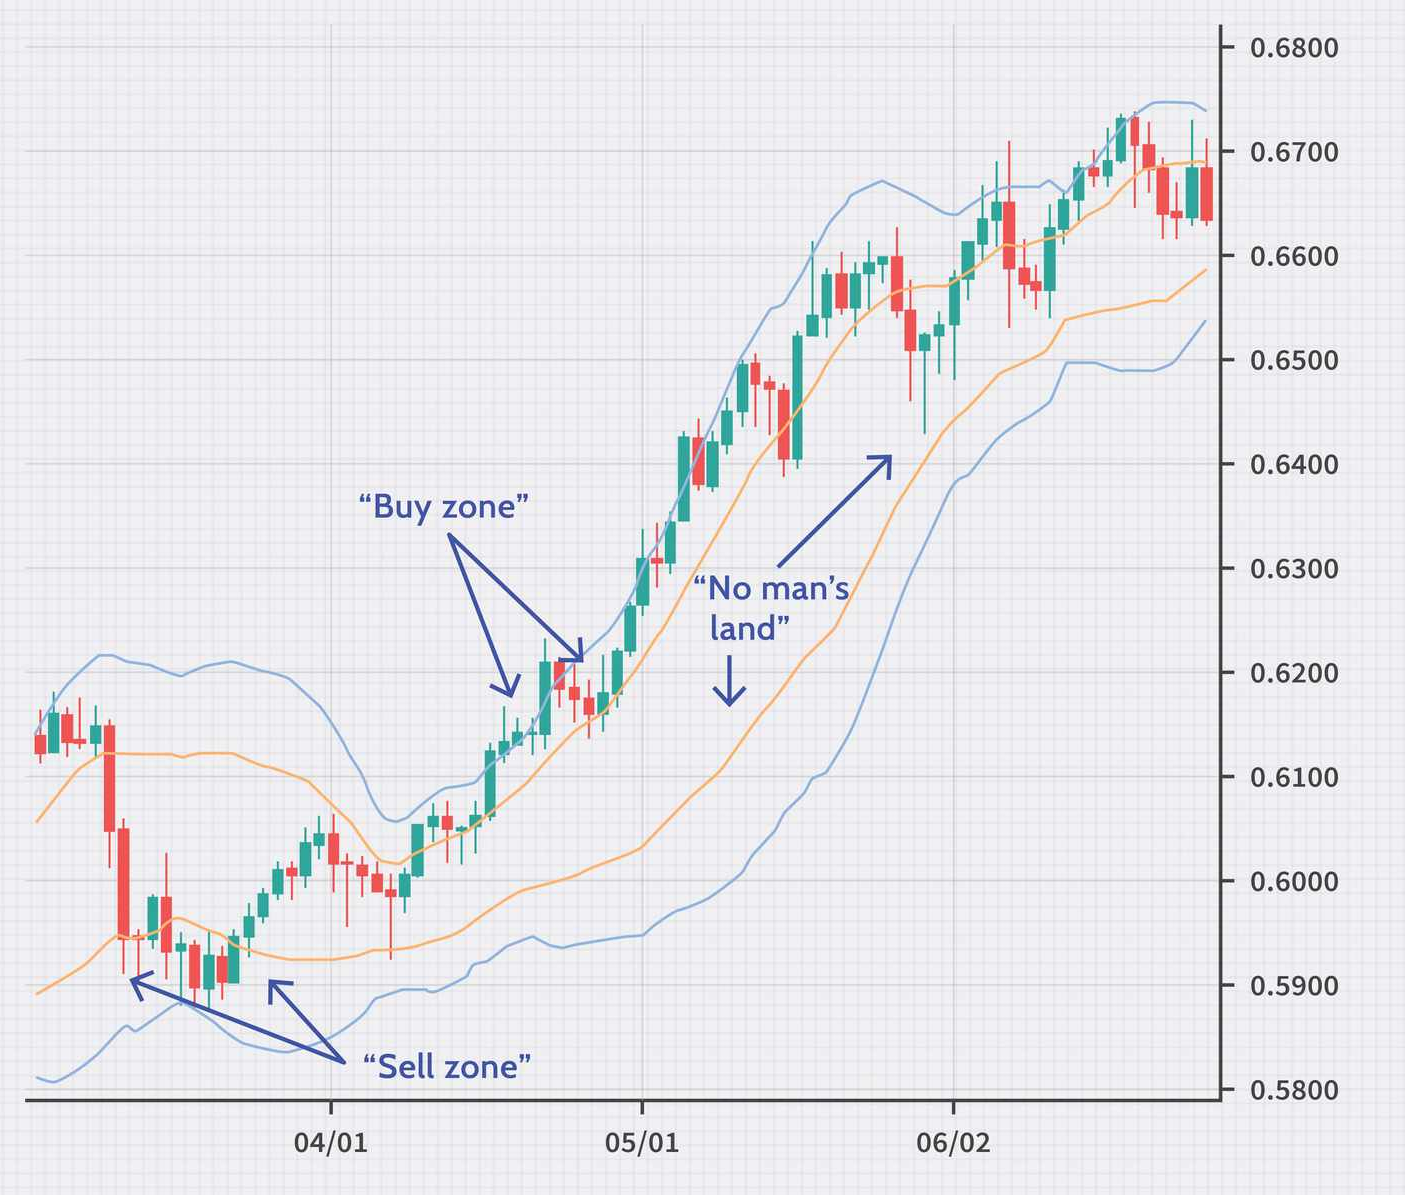
Bollinger Bands: Bollinger Bands are a technical analysis tool defined by a set of trendlines. They are plotted as two standard deviations, both positively and negatively, away from a simple moving average (SMA) of a security’s price1. The Bollinger Band formula is as follows1:
BOLU=MA(TP,n)+m∗σ[TP,n]
BOLD=MA(TP,n)−m∗σ[TP,n]
Where:
- BOLU = Upper Bollinger Band
- BOLD = Lower Bollinger Band
- MA = Moving average
- TP (typical price) = (High + Low + Close) ÷ 3
- n = Number of days in smoothing period (typically 20)
- m = Number of standard deviations (typically 2)
- σ[TP,n] = Standard Deviation over last n periods of TP
Average True Range (ATR): The ATR is a market volatility indicator used in technical analysis. It is typically derived from the 14-day simple moving average of a series of true range indicators2.
Keltner Channels: Keltner Channels are volatility-based bands that are placed on either side of an asset’s price and can aid in determining the direction of a trend. The Keltner channel uses the average-true range (ATR) or volatility, with breaks above or below the top and bottom barriers signaling a continuation3.
Relative Strength Index (RSI): The RSI is a momentum indicator used in technical analysis. RSI measures the speed and magnitude of a security’s recent price changes to evaluate overvalued or undervalued conditions in the price of that security. The RSI is displayed as an oscillator (a line graph) on a scale of zero to 1004.
Moving Average Convergence Divergence (MACD): The MACD is a trend-following momentum indicator that shows the relationship between two exponential moving averages (EMAs) of a security’s price. The MACD line is calculated by subtracting the 26-period EMA from the 12-period EMA. The signal line is a nine-period EMA of the MACD line5.
# Calculate the Simple Moving Average (SMA)
data['SMA'] = data['Close'].rolling(window=20).mean()

# Calculate the standard deviation
data['STD'] = data['Close'].rolling(window=20).std()

# Calculate the upper Bollinger Band
data['Upper'] = data['SMA'] + (data['STD'] * 2)

# Calculate the lower Bollinger Band
data['Lower'] = data['SMA'] - (data['STD'] * 2)
Wrapping things up!
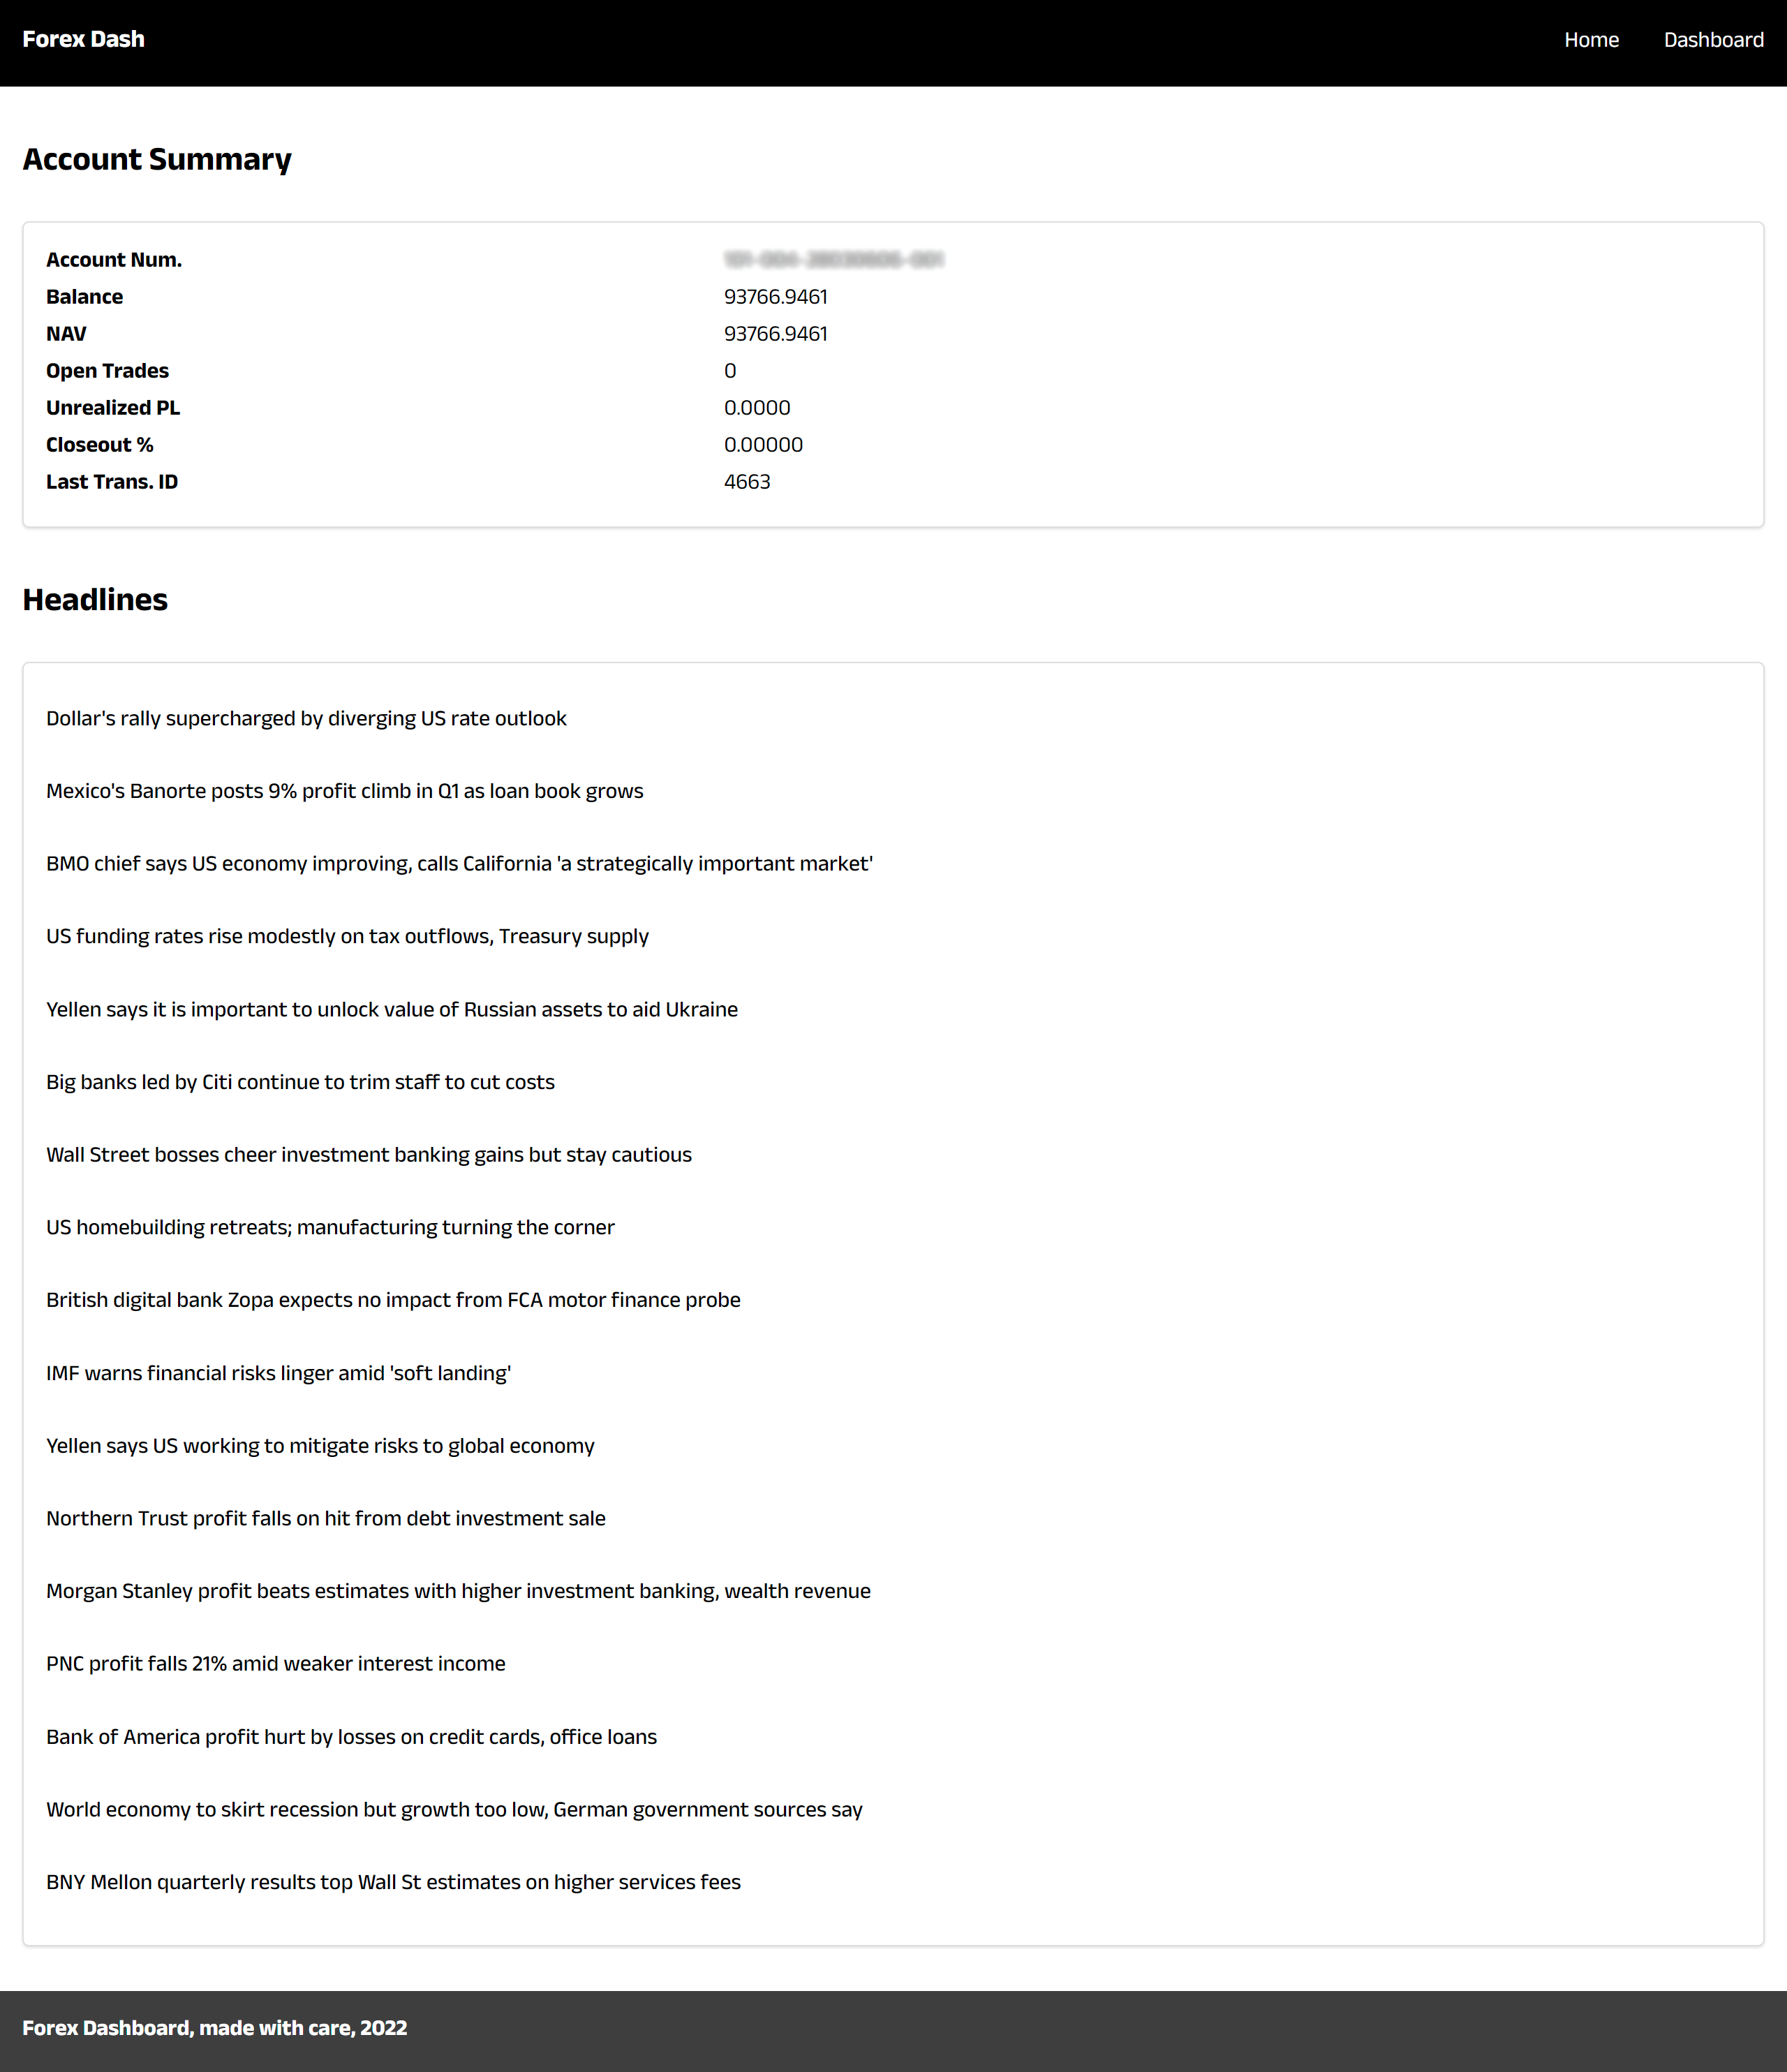
Python is an incredibly versatile language that can be used to enhance your trading strategies. By leveraging Python’s web scraping capabilities, you can gather live economic calendar data, headlines, and sentiments to inform your trading decisions.
Storing this information is also made easy with MongoDB, a popular NoSQL database, which allows for efficient storage and retrieval of data. This data can then be used to build a full-featured React web application, providing a user-friendly interface to display technicals, sentiments, headlines, prices, and even the status of your trading bot.
To facilitate interaction between your frontend and backend, you can create a Flask API. This backend can have various endpoints to access technicals, sentiments, headlines, prices, and more. This way, your React application can make requests to the Flask API to fetch the data it needs.
Once your trading bot is ready, you can deploy it to a cloud service. This allows your bot to run 24/7, making trades even while you sleep. There are many cloud service providers to choose from, such as AWS, Google Cloud, or Azure.
Lastly, implementing comprehensive logging is crucial for monitoring the performance of your trading bot. Logs can provide valuable insights when debugging issues or optimizing your trading strategy. Python’s built-in logging module makes it easy to log messages of varying levels of severity, which can then be analyzed to understand the bot’s decision-making process.
By following these steps, you can build a robust, automated trading bot from scratch. Remember, while this post provides a general roadmap, the specific implementation may vary depending on your trading strategy and requirements. Always ensure to back test your strategies and understand the risks involved in trading. Happy coding!
